线上问题排查思路(如忽然访问变慢)
- 链路追踪(zipkin skywalking等),确认问题在哪条链路上(是否是因为调用别人的接口引起的,解决方案熔断降级)
- 查看相应容器的prometheus,观察cpu、内存、网卡、磁盘等等
- cpu、内存问题,打开性能调试pprof具体调试cup或内存
内存泄漏问题,通常是goroutine泄漏所引起的。
查看goroutine数量,如果goroutine数量过多,可能是因为goroutine没有及时退出导致内存泄漏。top、list定位到具体代码,查看此goroutine退出机制是否有问题
极少情况是代码问题导致的内存泄漏,需要调试内存性能,top命令查看消耗内存的函数 list命令直接定位相关消耗内存的代码
cpu飙升,通常是因为io问题导致的,极少情况是代码问题,如死循环
查看性能监控如prometheus,如果cpu wait耗时,则确定是io问题
排查思路与上面一样,top、list排查
pprof还可以打开可视化界面查看,用户更友好
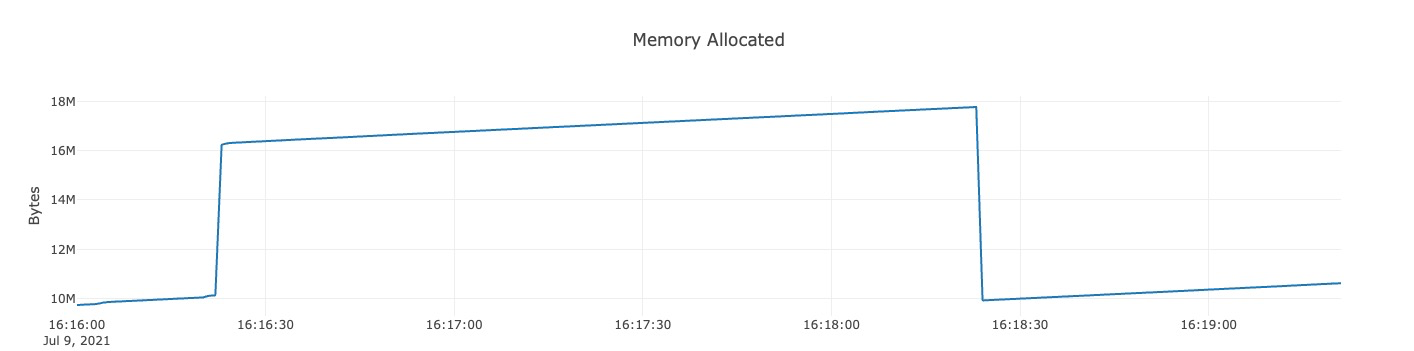
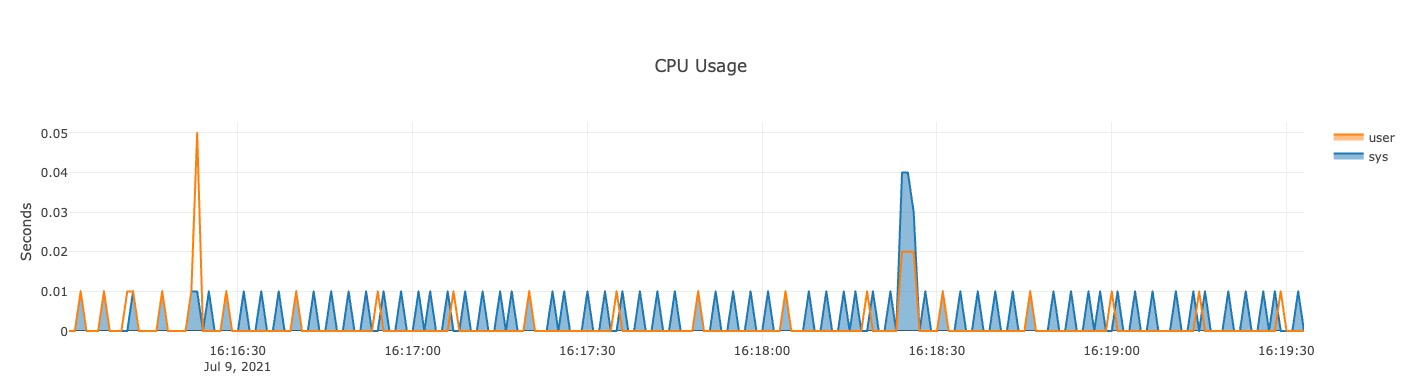
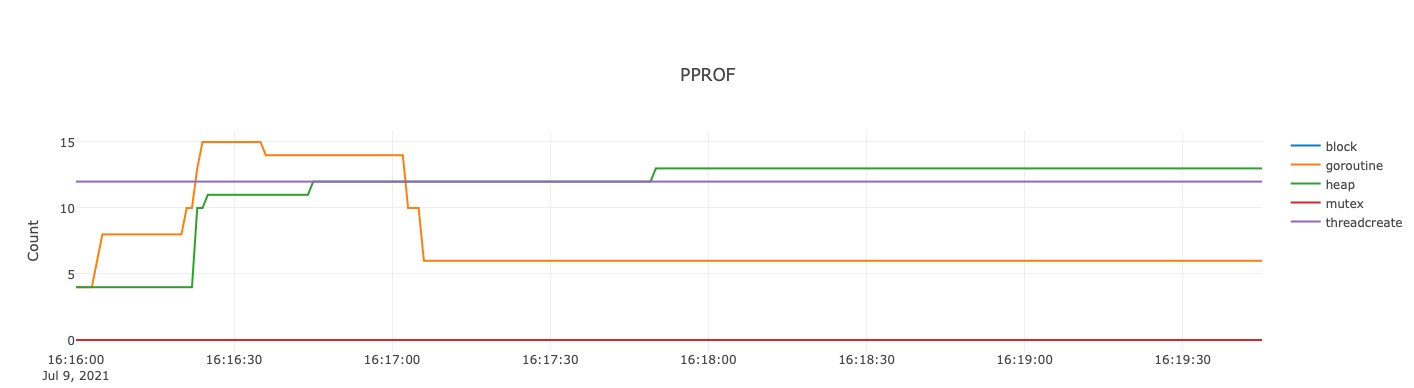
debugcharts
debugcharts 监控占用内存大,生产环境不建议开启。
一个可以实时查看golang程序内存、CPU、GC、协程等变化情况的可视化工具
_ "github.com/mkevac/debugcharts"

go func() {
        log.Println(http.ListenAndServe("localhost:8081", nil))
    }()
访问地址 localhost:8081/debug/charts
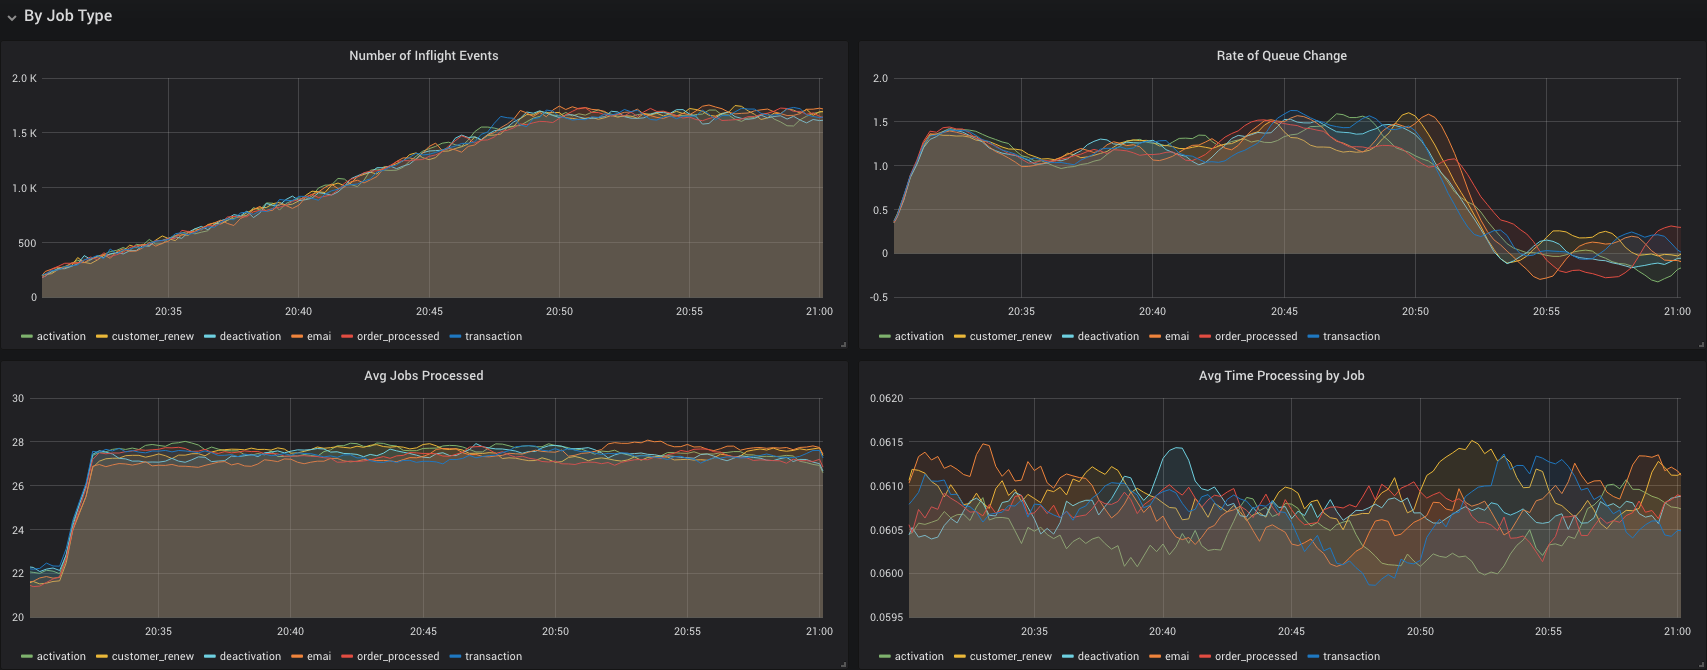
prometheus
prometheus 是 grafana 的插件,支持 go 监控的可视化
"github.com/prometheus/client_golang/prometheus/promhttp"

go func() {
        http.Handle("/metrics", promhttp.Handler())
        log.Println(http.ListenAndServe("localhost:8081", nil))
    }()
pprof
开启
开启pprof非常简单,只需要加入下面代码:
import (
    "net/http"
    _ "net/http/pprof"
)
go func() {
            log.Println(http.ListenAndServe("localhost:8081", nil))
}()
http://localhost:8081/debug/pprof/
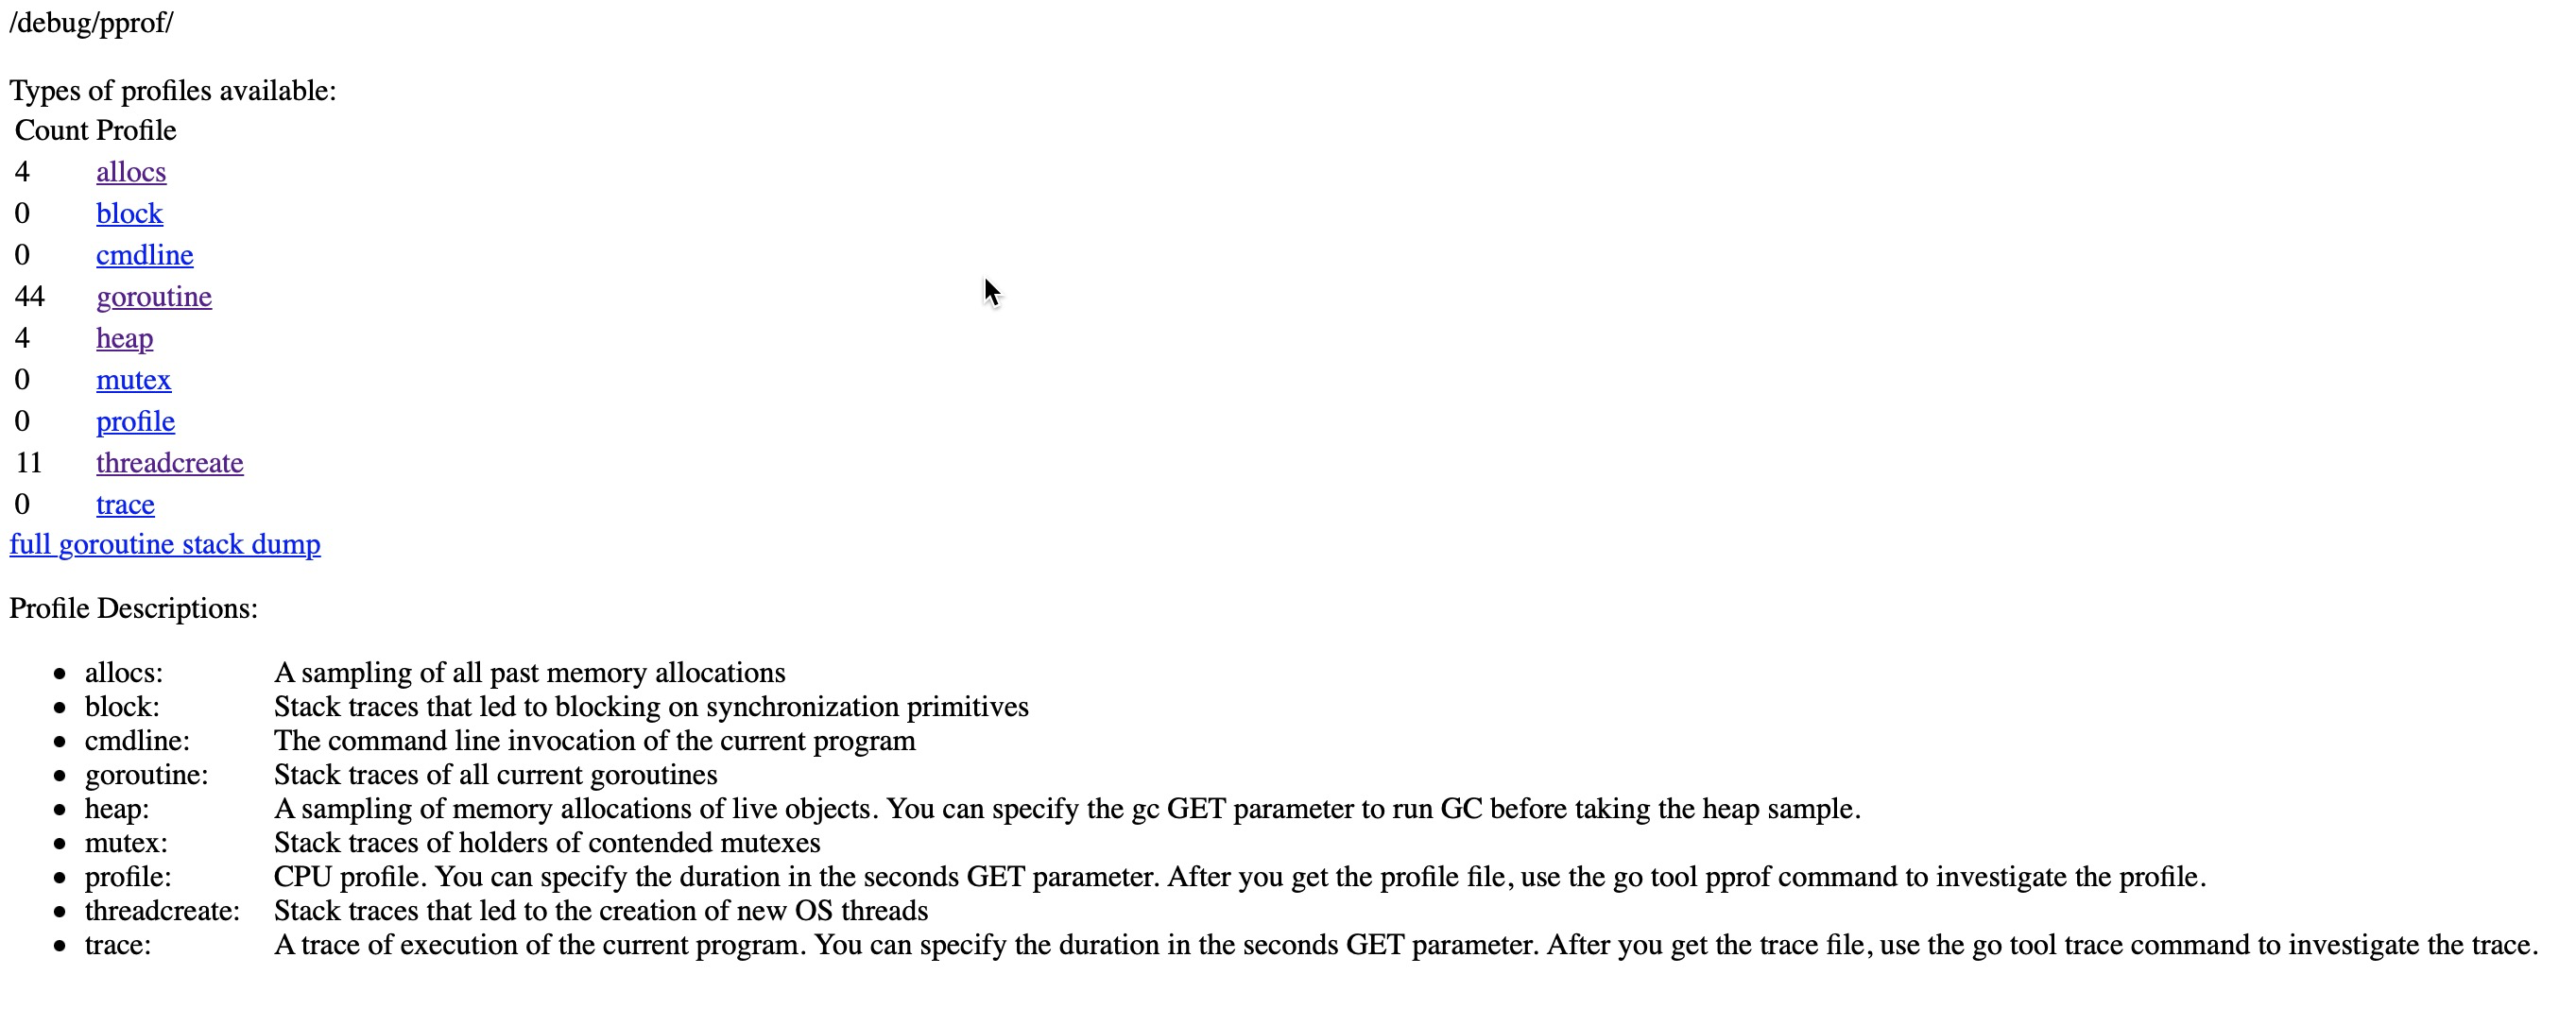
heap 堆内存使用情况
goroutine 当前在运行的goroutine情况以及总数
profile cpu耗时,会详细列出每个函数的好事
交互命令
# 生成 cpu profile
go tool pprof http://localhost:8081/debug/pprof/profile
# 生成 heap profile
go tool pprof http://localhost:8081/debug/pprof/heap
# 生成 goroutine profile
go tool pprof http://localhost:8081/debug/pprof/goroutine
# 生成 block profile
go tool pprof http://localhost:8081/debug/pprof/block
# 生成 mutex profile
go tool pprof http://localhost:8081/debug/pprof/mutex
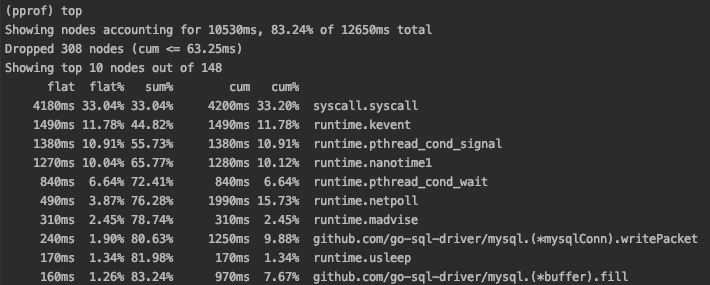
# 查看前20
(pprof) top 20
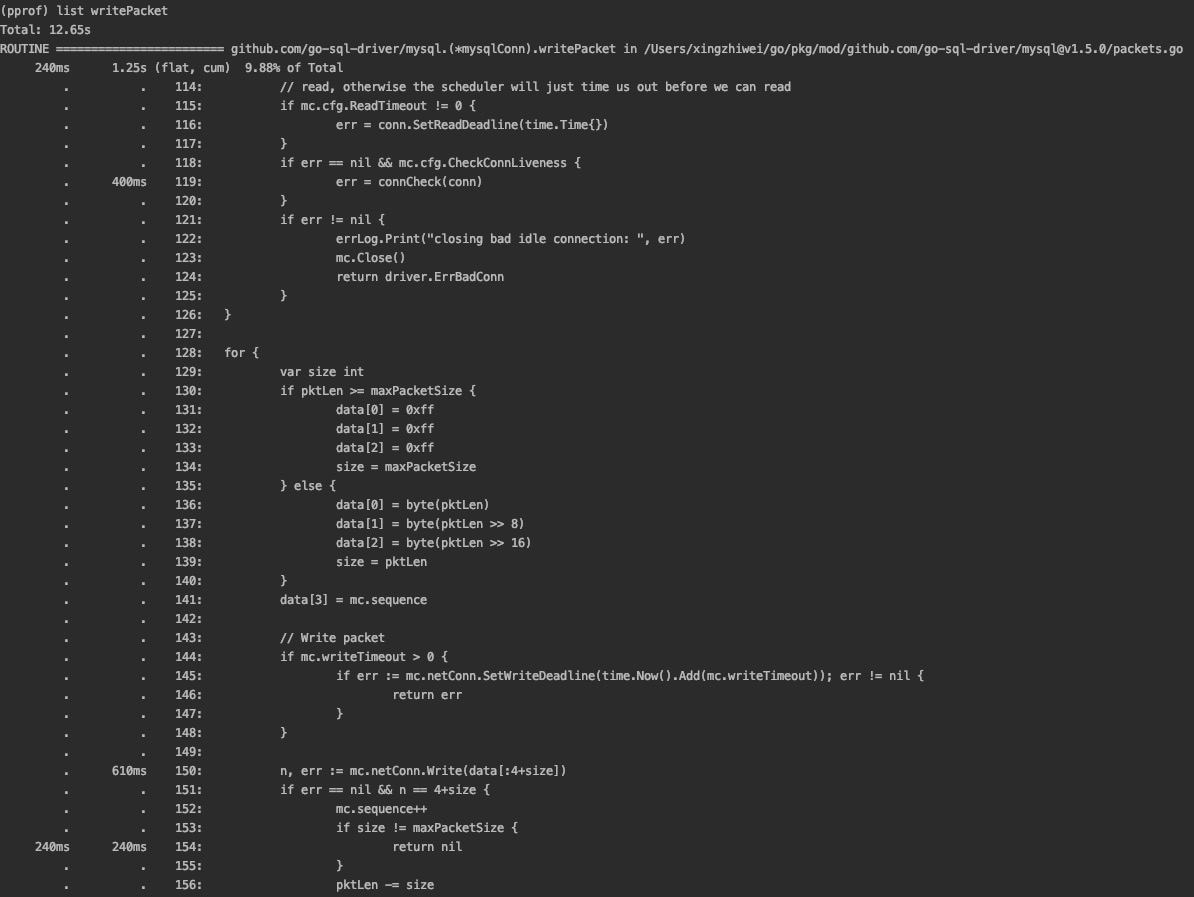
# 直接定位相关耗时的代码
list func_name
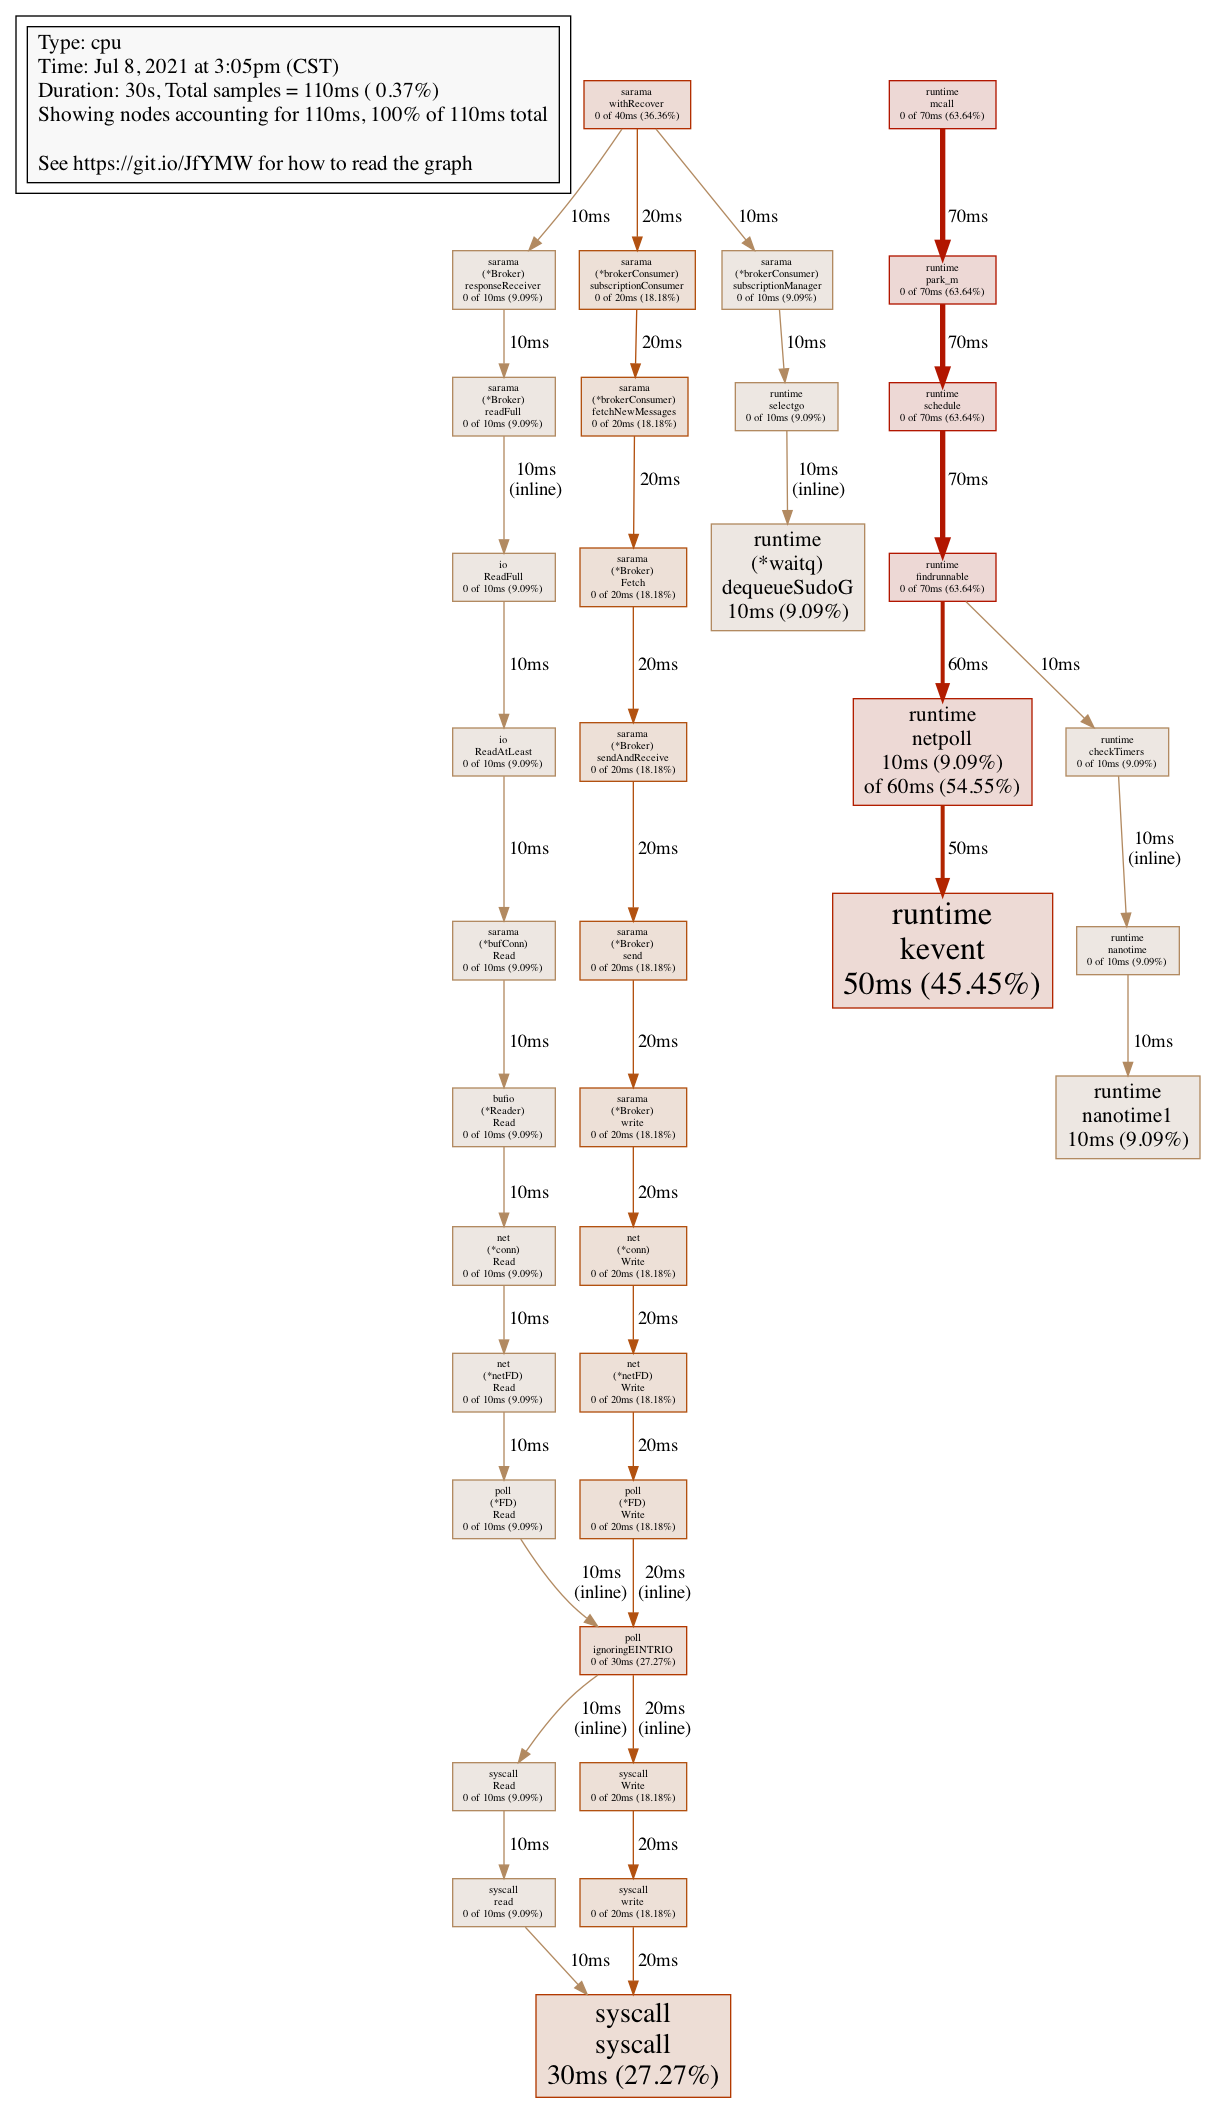
# web查看svg
(pprof) web
# 生成png文件
(pprof) png
# 查看已经保存的profile文件
go tool pprof profile /Users/xingzhiwei/pprof/pprof.samples.cpu.001.pb.gz

# 查看前20
(pprof) top 20
[
# 直接定位相关耗时的代码
list writePacket
[
# 列出函数调用栈
(pprof)traces
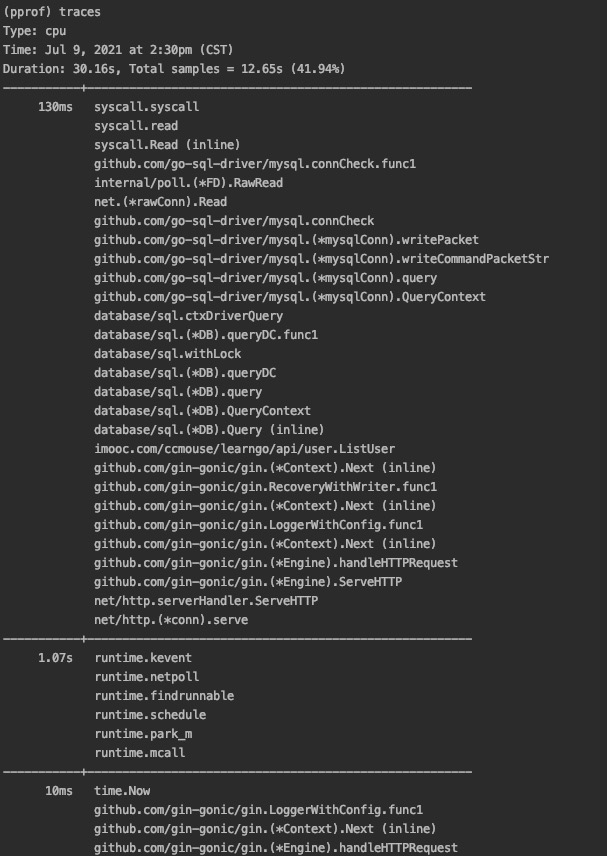
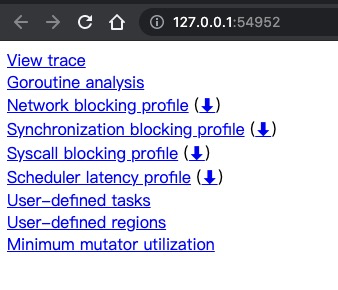
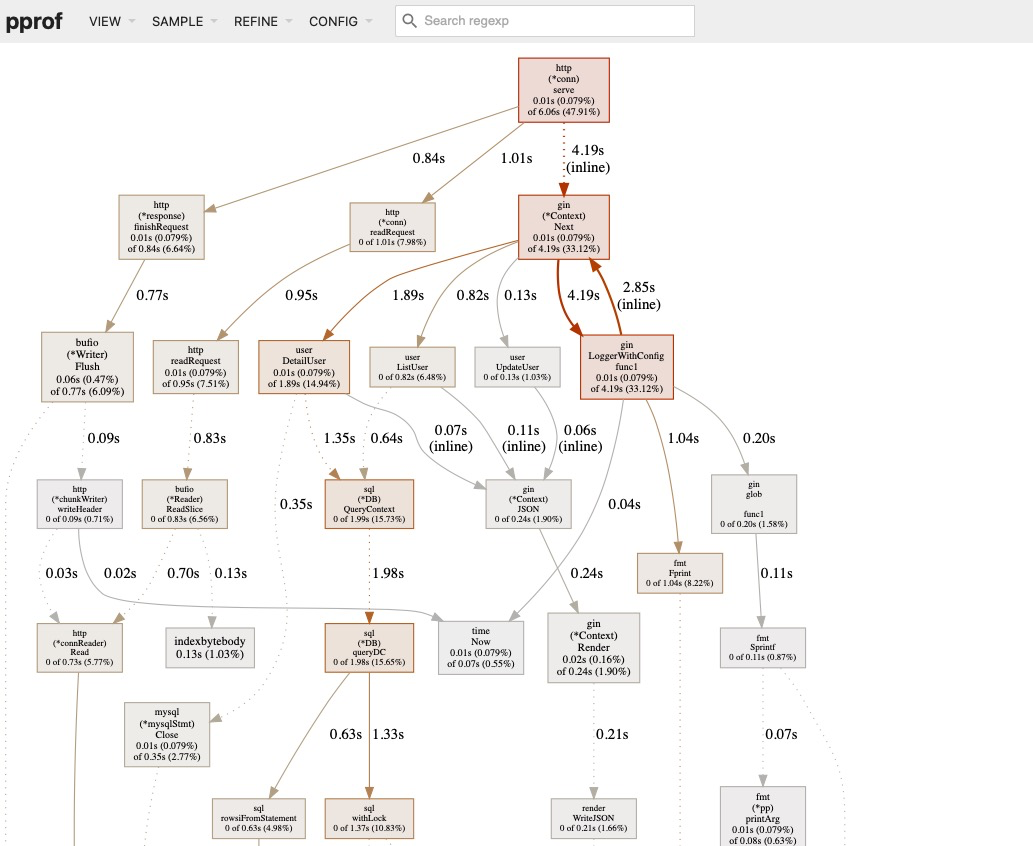
可视化操作界面(带火焰图)
go tool pprof --http=:8082 /Users/xingzhiwei/pprof/pprof.samples.cpu.004.pb.gz

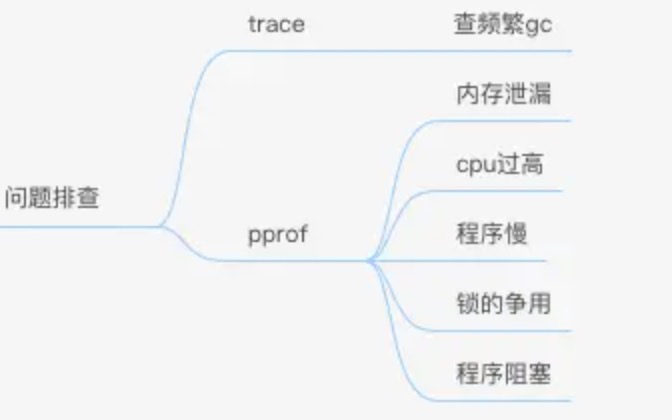
解决问题
- cpu过高
- 内存泄漏
- 程序慢
- 锁的争用
- 程序阻塞
查看cpu profile,聚焦长耗时函数
如果有 runtime.mallocgc 这和内存分配与垃圾回收有关
查找内存泄漏
使用内存profiling不能够发现内存泄露
profiling只记录对内存分配情况以及调用栈信息
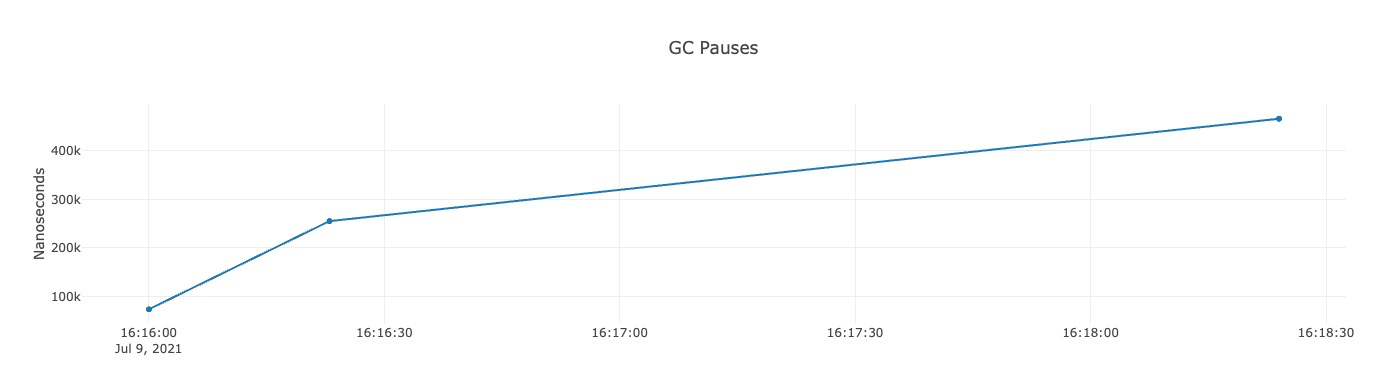
使用监控工具 Promethues 观察内存走势,可以知道是否有发生内存泄漏
内存泄漏通常是因为goroutine泄漏所引起的
# 生成 heap profile
go tool pprof http://localhost:8081/debug/pprof/heap
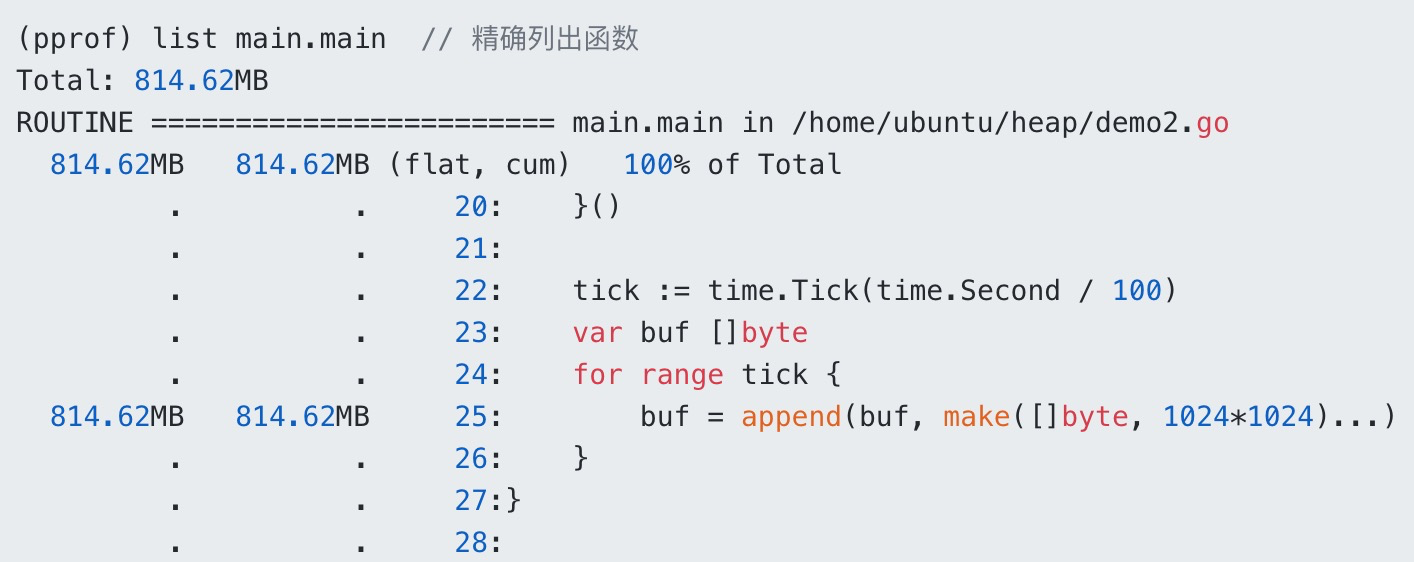
top 5
list main.main
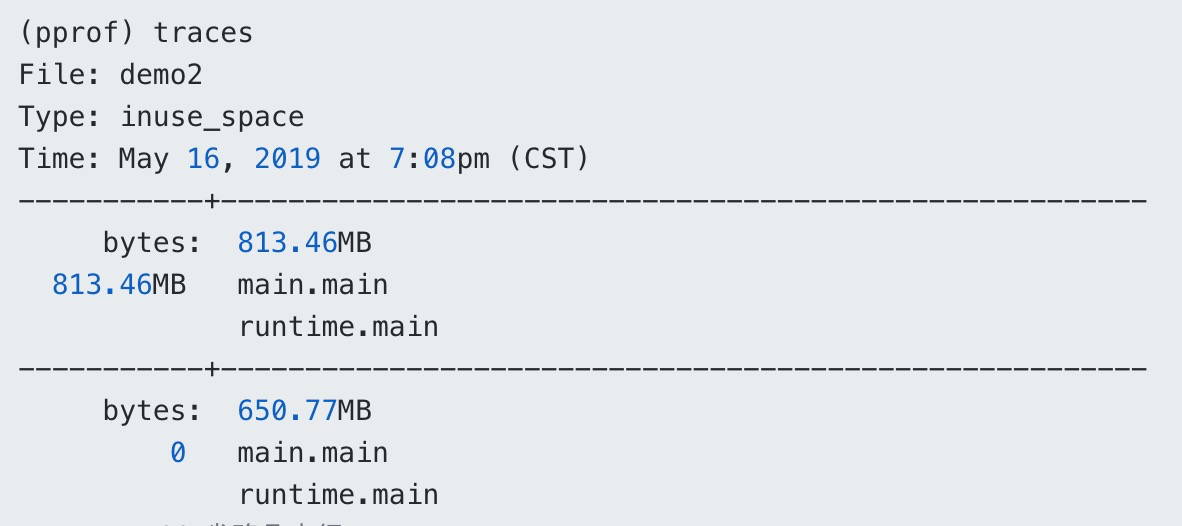
(pprof) trace
#打印所有调用栈,以及调用栈的指标信息
# -sample_index 参数,可以切换内存分析的类型
go tool pprof -sample_index=alloc_space /Users/xingzhiwei/pprof/pprof.alloc_objects.alloc_space.inuse_objects.inuse_space.002.pb.gz

go tool pprof --http=:8082 /Users/xingzhiwei/pprof/pprof.alloc_objects.alloc_space.inuse_objects.inuse_space.002.pb.gz
| 类型 | 含义 |
|---|---|
| inuse_space | amount of memory allocated and npt released yet |
| inuse_objects | amount of objects allocated and not released yet |
| alloc_space | total amount of memory allocated (regardless of released) |
| alloc_objects | total amount of objects allocated (regardless of released) |
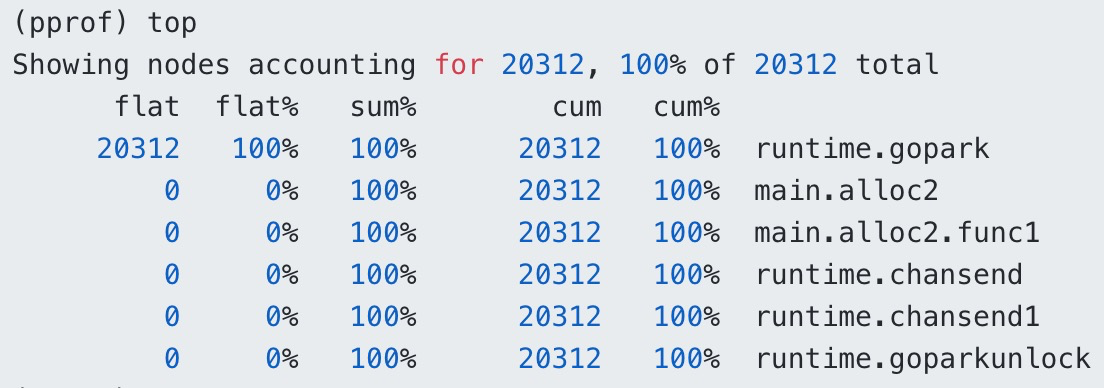
goroutine泄漏
- 每个goroutine占2kb
goroutine执行过程中,有些变量只想堆内存,gc回认为内存仍然在使用,不会回收(这部分heap profile能体现出来)
如果不知道何时停止一个goroutine,这个goroutine就是潜在的内存泄露
如何判断是goroutine泄漏导致的内存泄漏,监控goroutine数量,goroutine持续增长,则可能是goroutine泄漏
# 生成 goroutine profile
go tool pprof http://localhost:8081/debug/pprof/goroutine
top
# 重复两次以上操作,看看是哪个goroutine泄漏
# 两个比较
go tool pprof -base pprof.leak_demo.goroutine.001.pb.gz pprof.leak_demo.goroutine.002.pb.gz
list
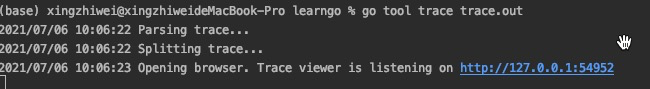
go tool trace trace.out
traces
trace
gc trace
- GODEBUG=gctrace=1
go build main.go -o main
GODEBUGE=gctrace=1 ./main

GODEBUG=gctrace=1 go run main.go

# GODEBUG 参数还有 schedtrace=1 scheddetail=1 Go Runtime Scheduler 状态信息
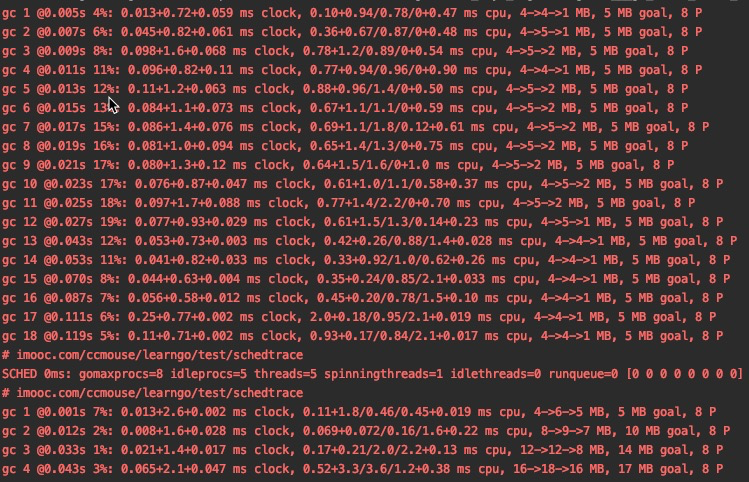
| 字段 | 含义 |
|---|---|
| gc 1 | 第一个gc周期 |
| @0.005s | 程序开始后的0.005s |
| 4% | 改gc周期中cpu的使用率 |
| 0.013 | 标记开始时,STW所花费的时间(wall clock) |
| 0.72 | 标记过程中,并发标记所花费的时间(wall clock) |
| 0.059 | 标记终止时,STW所花费的时间(wall clock) |
| 0.10 | 标记开始时,STW所花费的时间(cpu time) |
| 0.94 | 标记过程中,标记辅助所花费的时间(cpu time) |
| 0.78 | 标记过程中,并发标记所花费的时间(cpu time) |
| 0 | 标记过程中,gc空闲的时间(cpu time) |
| 0.47 | 标记终止时,STW所花费的时间(cpu time) |
| 4 | 标记开始时,堆的大小的实际值 |
| 4 | 标记结束时,堆的大小的实际值 |
| 1 | 标记结束时,标记为存活的对象大小 |
| 5 | 标记结束时,堆的大小的预测值 |
| 8 | P的数量 |
wall clock 是指开始执行到完成所经历的实际时间,包括其他程序和本程序所消耗的时间;
cpu time 是指特定程序使用 cpu 的时间;它们存在以下关系:
wall clock < cpu time:充分利用多核
wall clock ≈ cpu time:未并行执行
wall clock > cpu time:多核优势不明显
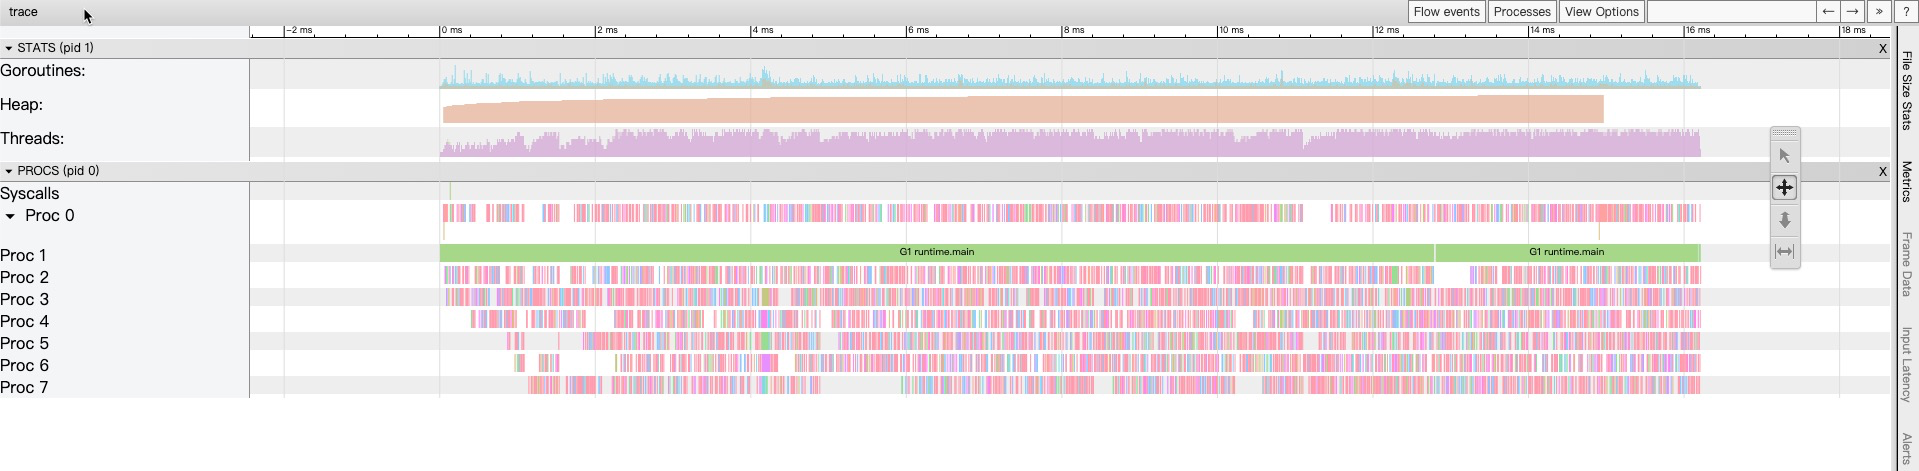
trace 工具
- go tool trace
f, err := os.Create("trace.out")
    if err != nil {
        panic(err)
    }
    defer f.Close()

    err = trace.Start(f)
    if err != nil {
        panic(err)
    }
    defer trace.Stop()
go tool trace trace.out